


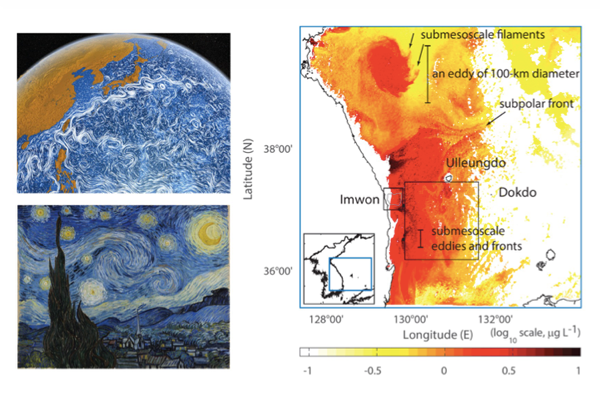
In 2012, the United States National Aeronautics and Space Administration (NASA) released a movie clip called “Perpetual Oceans”, which visualized ocean circulation obtained from satellite altimeter-derived sea surface height observations over two and a half years. When the movie was released to the public, it received a great deal of attention because the circulation patterns were strikingly similar to “The Starry Night” by Vincent van Gogh. “Perpetual Oceans” is full of vortical flow patterns describing the oceanic turbulent motions at mesoscale (a scale of 100 km or larger). Meanwhile, Professor Sung Yong Kim from the Department of Mechanical Engineering and his team focused on study of oceanic turbulence at submesoscale (space and time scales of 1 to 100 km and hours). Submesoscale processes are important because they contribute to the vertical transport of oceanic tracers, mass, buoyancy, and nutrients and rectify both the mixed layer structure and upper ocean stratification. These process studies have been primarily based on numerical simulations because traditional in situ ocean measurements can be limited in their capability to resolve detailed horizontal and vertical structures of those processes.
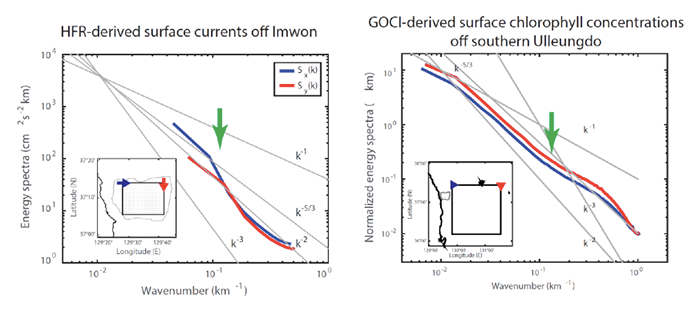
The team conducted ‘big data’ analysis on hourly observations of one-year ocean surface current maps and five-year chlorophyll concentration maps, obtained from remote sensing instruments such as coastal high-frequency radars (HFRs) and geostationary ocean color imagery (GOCI), to examine the unique characteristics of oceanic submesoscale processes. The team analyzed the slope change of the wavenumber energy spectra of the observations in terms of season and sampling directions. Through the analysis, the team proved that energy cascade (a phenomenon in which large-scale energy transfers to small-scale energy or vice-versa during turbulent energy transit) occurs at a spatial scale of 10 km in the forward and inverse directions. Based on the observed regional submesoscale circulation, this phenomenon is driven by baroclinic instability at O(10) km scale, as opposed to the mesoscale eddy-driven frontogenesis at the O(100) km scale.
This work will contribute to the parameterization of physical phenomenon at submesoscale in the fields of global high-resolution modeling within ocean physics and atmospheric science, as well as in the area of climate change. Based on the understanding of the principles of sub-mesoscale surface circulation, practical applications can be further derived for radioactivity, oil spill recovery, and marine pollutant tracking.
Prof. Dr. Sung Yong Kim Dept. of Mechanical Engineering, KAIST
Homepage: http://efml.kaist.ac.kr
E-mail: syongkim@kaist.ac.kr
