


Professor Jong-Hwan Kim’s research team defined a 3-D scene graph [1], which represents physical environments in a sparse and semantic way, and proposed a 3-D scene graph construction framework. The proposed 3-D scene graph describes environments compactly by abstracting the environments as graphs, in which nodes depict the objects and edges characterize the relations between pairs of objects. As the proposed 3-D scene graph illustrates environments in a sparse manner, the graph can cover an extensive range of physical spaces, which guarantees scalability. Even when agents have to deal with a broad range of environments or encounter new environments in the middle, 3-D scene graphs offer a quick way of accessing and updating environment models. Furthermore, the concise structure of the 3-D scene graph ensures intuitive usability. The graph structure is straightforward because the 3-D scene graph follows the conventions of common graph structures and graph structures, due to their wide use, are already familiar to the majority of researchers.
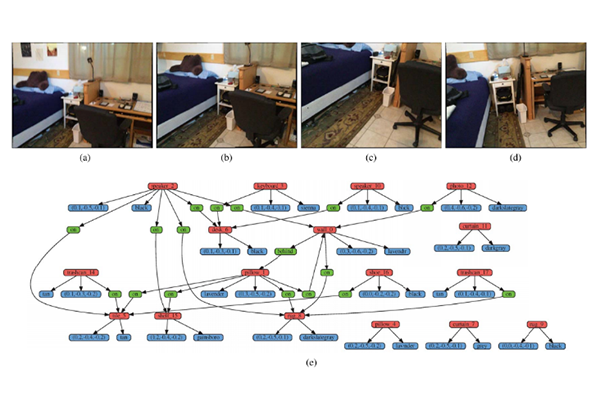
In the process of generating 3-D scene graphs for the given environments, the proposed 3-D scene graph construction framework extracts relevant semantics within environments, such as object categories and relations between objects, as well as physical attributes, such as 3-D positions and major colors. The framework receives a sequence of observations in the form of RGB-D image frames. For robust performance, the framework filters out unstable observations (i.e., blurry images) using the proposed adaptive blurry image rejection (ABIR) algorithm. Then, the framework factors out keyframe groups to avoid redundant processing of the same information. Keyframe groups contain reasonably overlapping frames. Next, the framework extracts semantics and physical attributes within the environments through the recognition modules. During the recognition processes, spurious detections are rejected. Finally, the gathered information gets fused into a 3-D scene graph and the graph gets updated upon new observations.
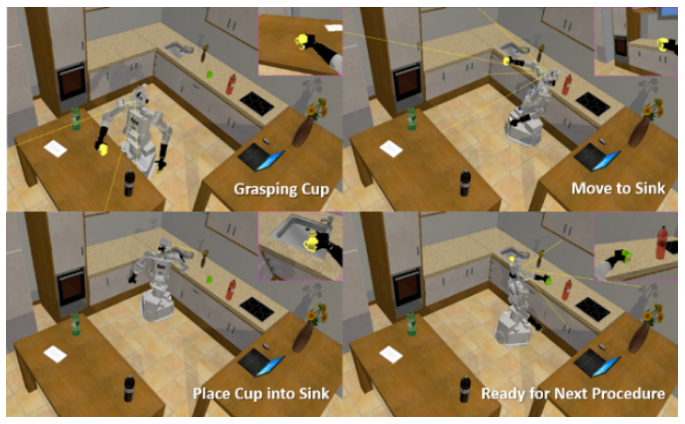
Two major applications verify the effectiveness of the 3-D scene graph: 1) Visual questioning and answering and 2) task planning with FF planner. First, intelligent agents with 3-D scene graphs can effectively answer four types of questions. 1) Object Counting: Either simple (e.g., how many cups are in the environment?) or hierarchical (e.g., how many pieces of cutlery are there?), 2) Counting with attributes: Number of objects with specific attributes, such as size, visual feature, and location (e.g., how many red chairs are in the environment?), 3) Counting with relations: Number of objects distinctively related to a specific object (e.g., how many objects are on the shelf?), and 4) Multimodal VQA: Answer by providing a thumbnail of an object (e.g., show me the biggest bowl in the environment).
Second, FF planner requires two types of descriptions: 1) problem description and 2) domain description. The problem description contains information regarding the categories and states of objects and the goal definition. The domain description describes the primitive actions robots can take. The descriptions are written in planning domain definition language (PDDL). The 3-D scene graphs can be directly changed into the problem description format, which stores the information the FF planner needs. A few rule-bases can transform 3-D scene graphs into problem descriptions.

Ue-Hwan Kim, Jin-Man Park, Taek-Jin Song, Jong-Hwan Kim School of Electrical Engineering, KAIST
Homepage: http://rit.kaist.ac.kr
E-mail: johkim@rit.kaist.ac.kr
