


Professor Bumseok Jeong’s research team (the first author, Kyu Sung Choi, Ph.D. candidate, and co-corresponding author, Professor Seung Hong Choi) has developed an explainable convolutional recurrent neural network model with high diagnostic performance – 92.1% sensitivity, 91.5% specificity, and 91.7% accuracy – that predicts the IDH genotype of gliomas, which is crucial in treatment planning and prognosis prediction (Neuro-Oncology, 2019).
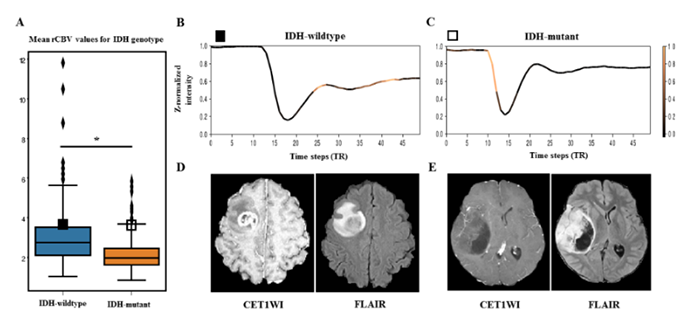
IDH mutation has been known to be associated with strong inhibition of upstream regulator, or hypoxia-inducible factor (HIF-1 α), leading to decreased downstream tumor angiogenesis in gliomas. With the invasiveness of brain biopsy, and despite its usefulness for predicting prognosis, previous studies have utilized relative cerebral blood volume (rCBV), which reflects tumor angiogenesis, or vascularity, derived from dynamic susceptibility contrast (DSC) perfusion MRI, to predict IDH genotype of gliomas. However, there is a large overlap of rCBV between IDH-wildtype and IDH-mutant groups, which leads to an inaccurate prediction of IDH genotype (see Figure1-A). The research team successfully demonstrated that a recurrent neural network model, which learns “temporal patterns” specific to IDH genotype, can distinguish this overlapped group by utilizing raw T2* susceptibility signal intensity-time curves obtained from DSC perfusion MRI (sensitivity 92.6%, specificity 93.1%, accuracy 92.8%). Furthermore, the proposed model provides interpretability by using attention mechanisms to demonstrate which temporal features are crucial for the prediction of IDH genotype (Figure 1-B, C).
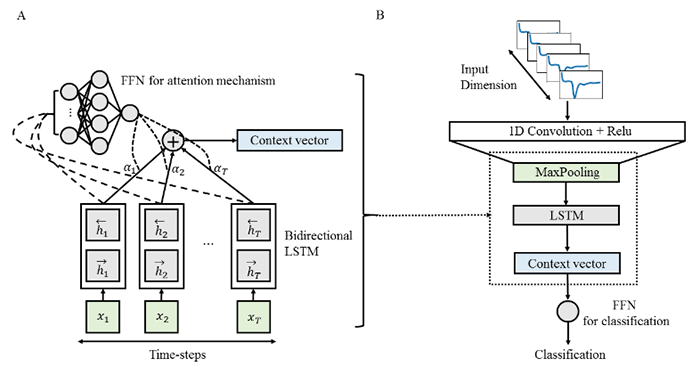
This work of explainable AI (Figure 2) may contribute to providing noninvasive IDH genotyping, essential for treatment planning and prognosis prediction for patients with deep-seated gliomas and high anesthesia risks.
Kyu Sung Choi Graduate School of Medical Science and Engineering, KAIST
Homepage: https://drshrink.github.io
E-mail: bs.jeong@kaist.ac.kr
