


The research team of Professor YongKeun Park in KI for Health Science and Technology (KIHST) measured the morphological, biochemical, and mechanical properties of healthy and diabetic red blood cells (RBCs) to quantitatively address the diabetic effects on RBCs using 3-D quantitative phase imaging (QPI) techniques. Unlike previous methods, 3-D QPI technique has the advantage of being able to quantitatively and simultaneously measure the multiple RBC parameters in a non-invasive manner at the individual cell level as shown in Figure 1.
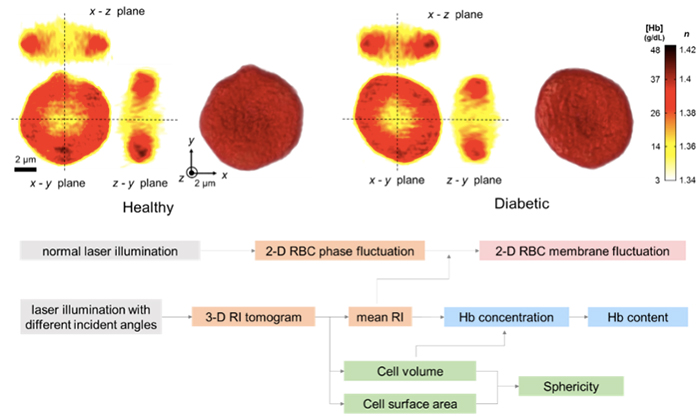
The 3-D QPI technique enables the measurement of 3-D refractive index (RI) tomograms of individual RBCs. The volume and surface of an individual RBC can be directly calculated from the reconstructed 3-D RI tomogram. Then, sphericity, a measure of cell sphere-likeness, can be obtained as a normalized volume-to-surface area ratio as can be seen in Figure 2. Furthermore, the concentration of hemoglobin (Hb) in RBCs can be obtained from the average RI value of cells, and Hb content can also be calculated using the volume information.
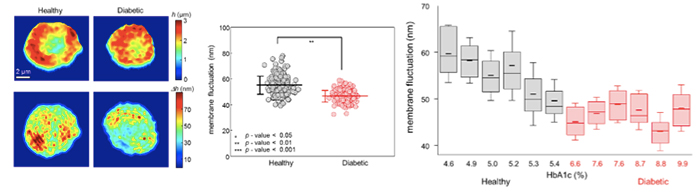
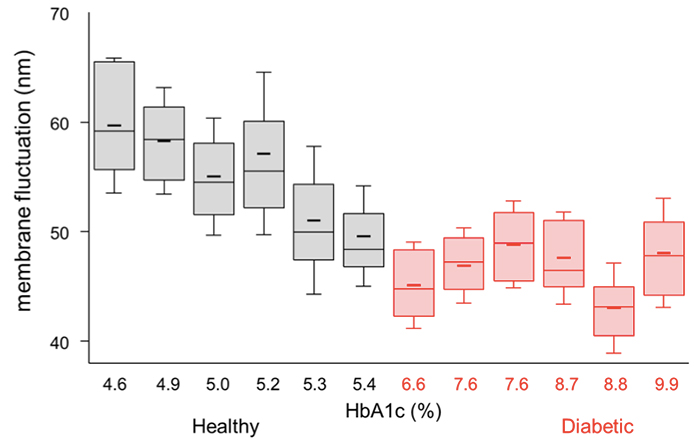
Lastly, the 2-D phase map of RBCs measured continuously over a period of time is used to calculate the membrane fluctuation, a parameter that quantitatively indicates how much the cell membrane is vibrating (Figure 3). We measured 40 RBCs per subject for total six healthy and six diabetic subjects. As a result, no statistical difference was found between the morphological (volume, surface area,, and sphericity) and biochemical (Hb concentration and content) parameters of normal and diabetic RBCs. However, diabetic RBCs clearly exhibited significantly diminished membrane fluctuations compared to normal RBCs, which means the diabetic RBCs deformability is reduced. In addition, there was a negative correlation between RBC membrane fluctuation and HbA1 level. Our measurements of membrane fluctuations of diabetic RBCs imply that the irreversible and slow glycation process of Hb molecules and membrane proteins deteriorate the RBCs’ deformability.
This work was recently accepted for publication in Scientific Reports.
Park, YongKeun and Lee, SangYun (Department of Physics)
Homepage: https://bmol.kaist.ac.kr
E-mail: yk.park@kaist.ac.k
